The three configurations
Exported from the Wailawi 3D editor as wailawi_K1_normal.json, K2_kilang.json, K3_all.json. The same point sets drive the ray tracing on the other tabs.
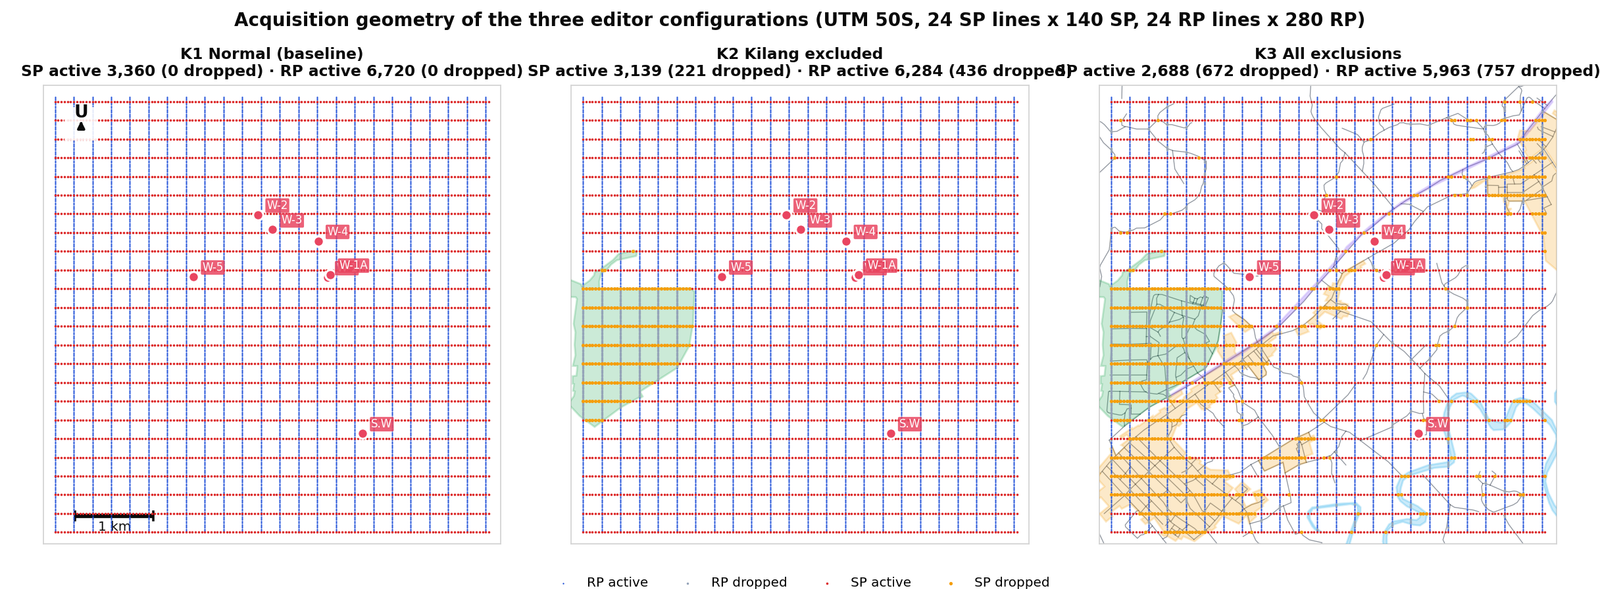
Acquisition geometry
Active vs dropped stations in UTM 50S — the exclusions carve holes out of both the source and the receiver spread.
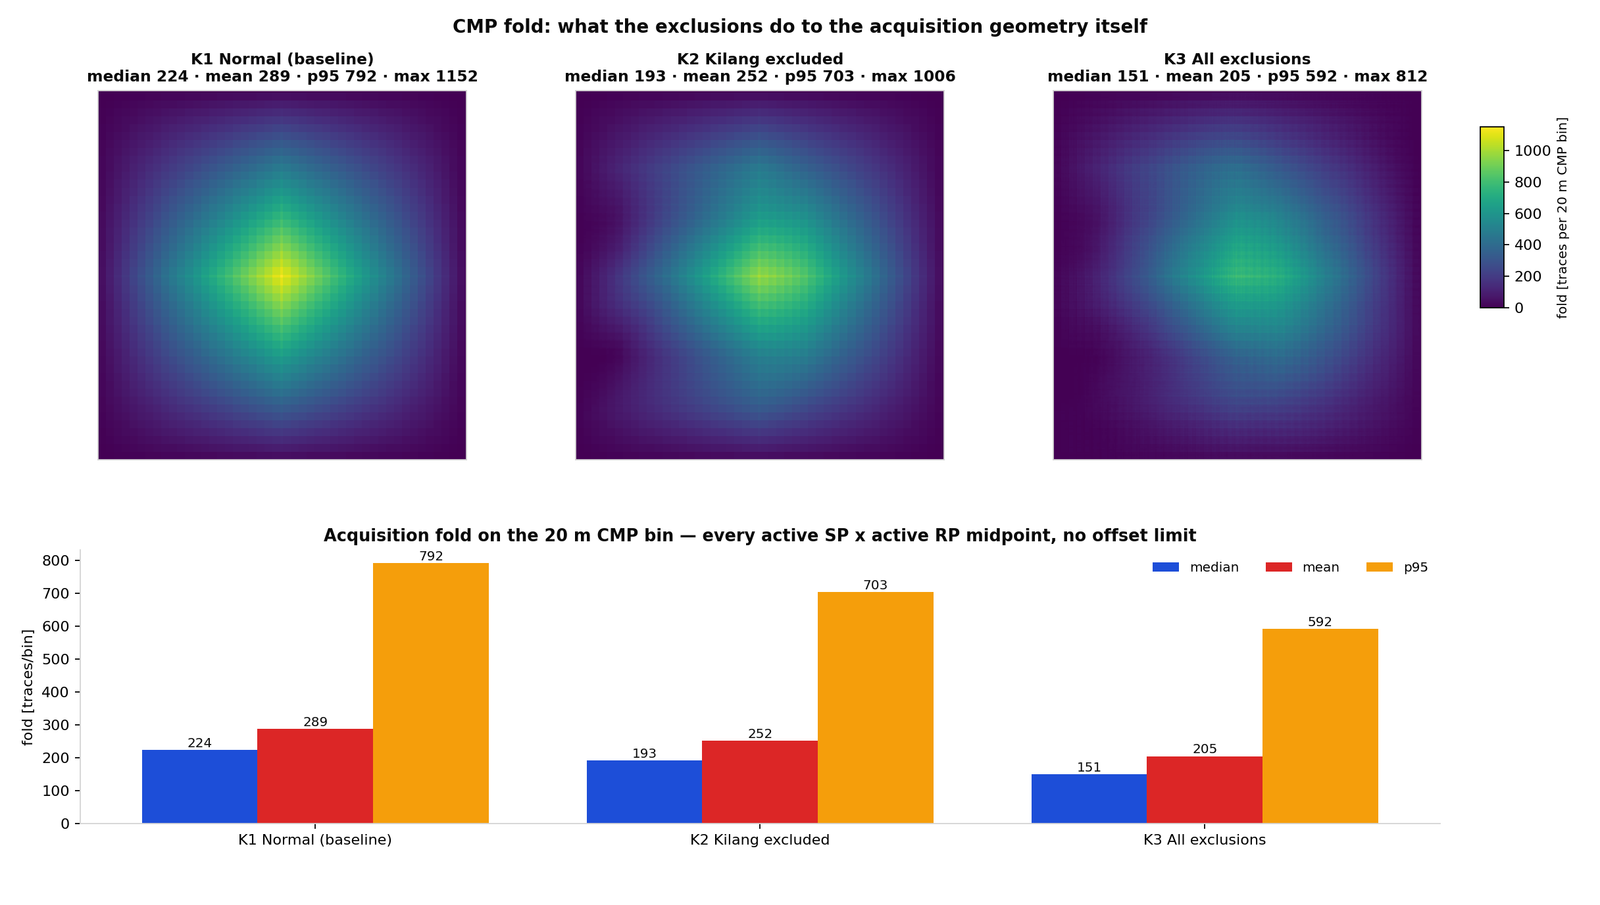
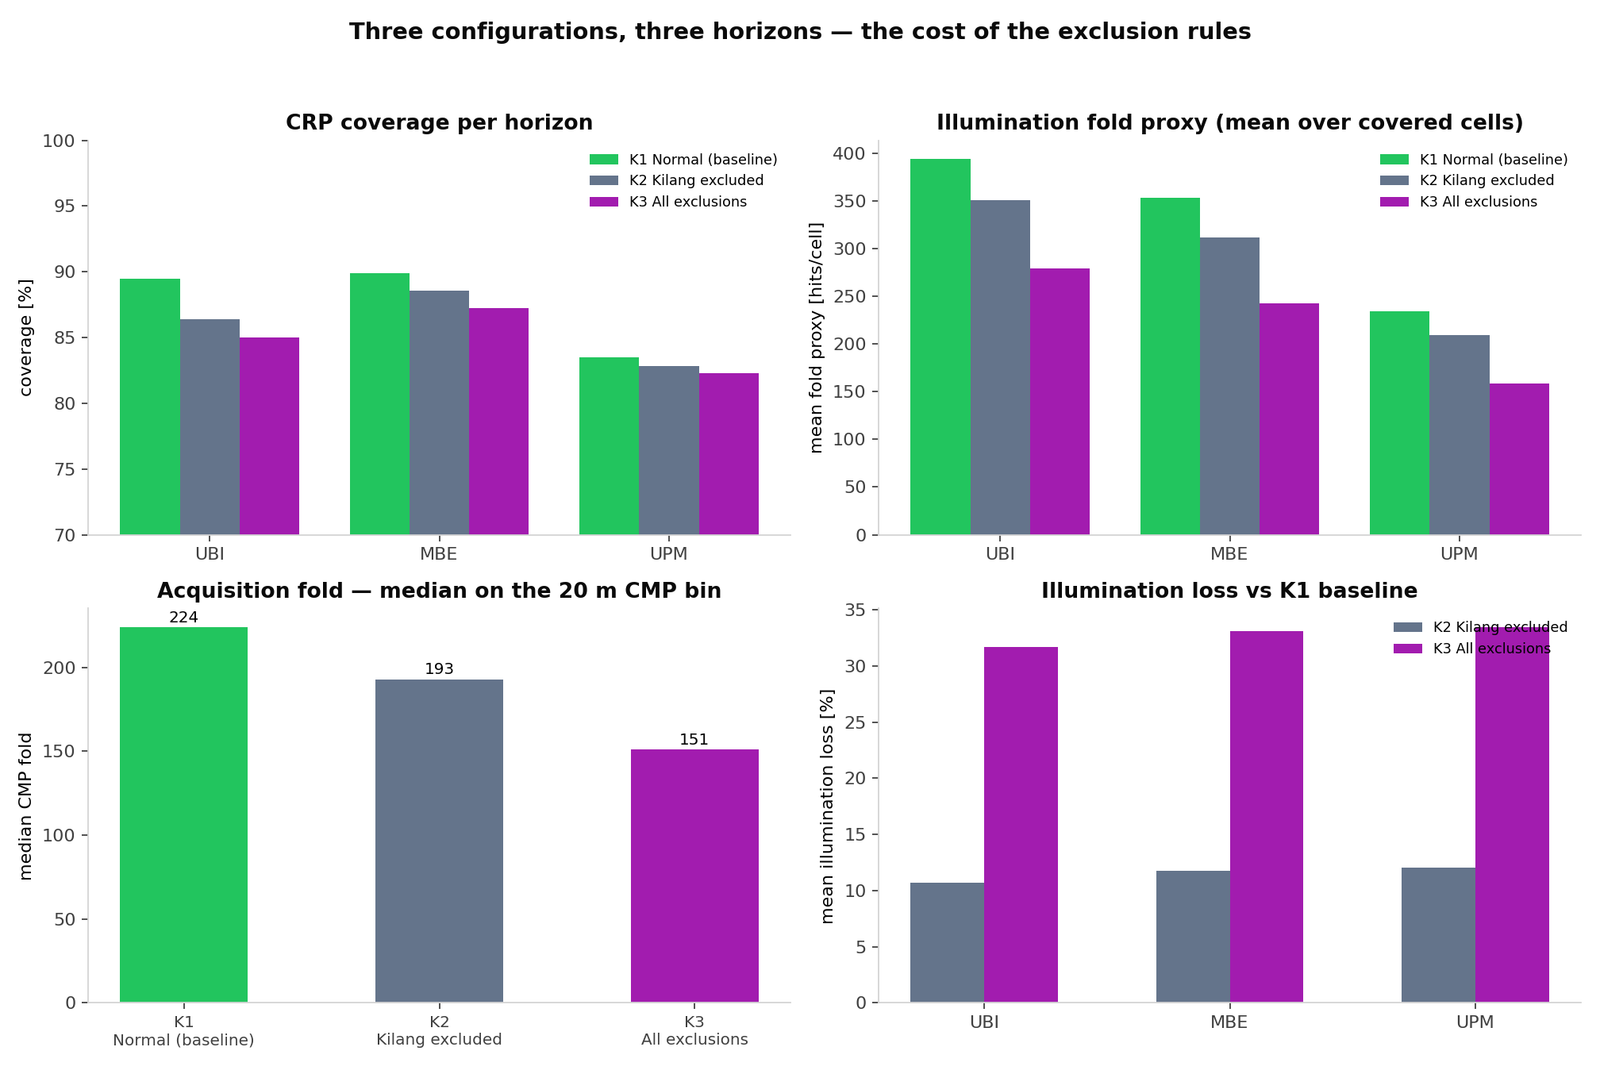
Acquisition fold (20 m CMP bin)
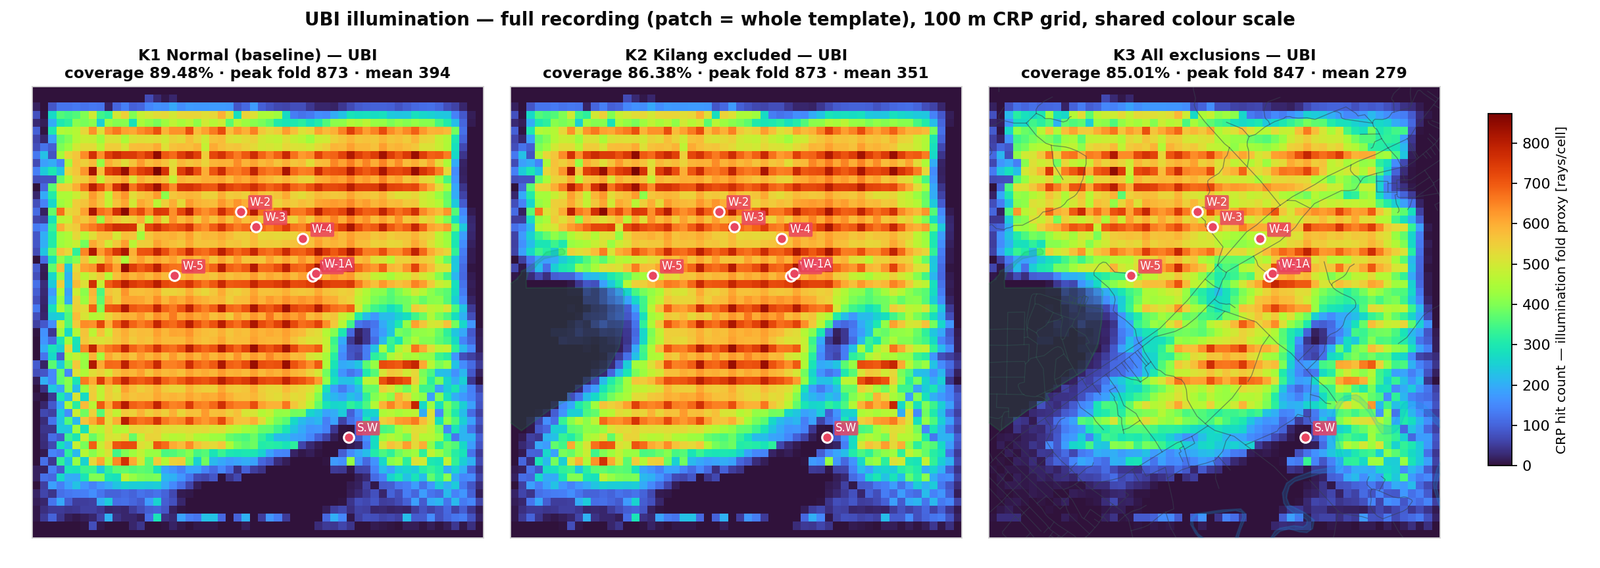
Illumination fold proxy by configuration
UBI — full recording, 100 m CRP grid, shared colour scale.
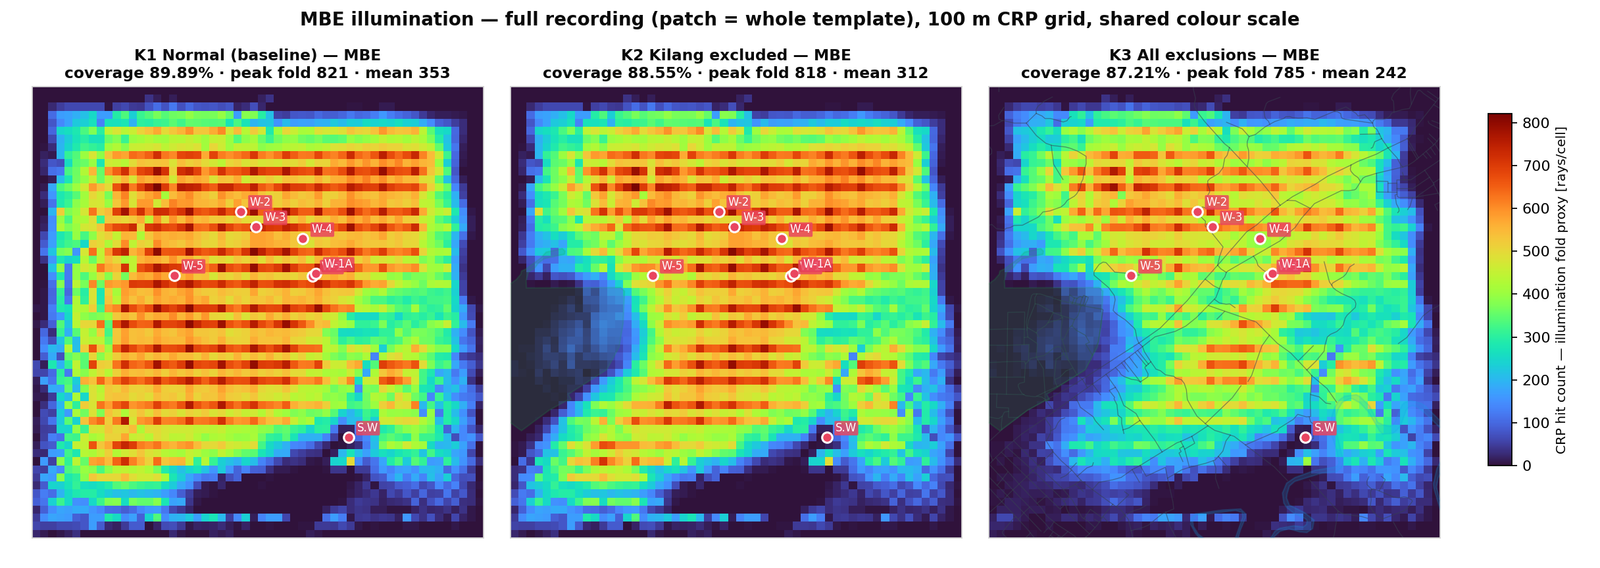
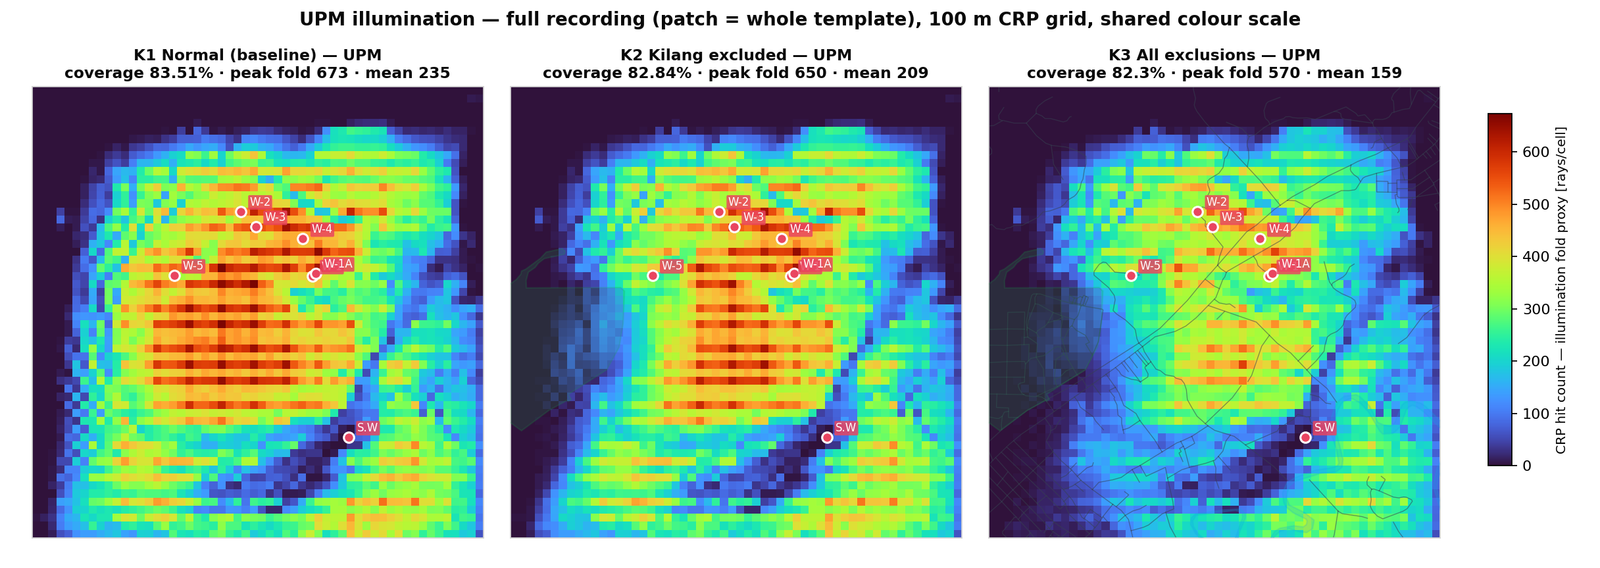
Illumination loss against K1
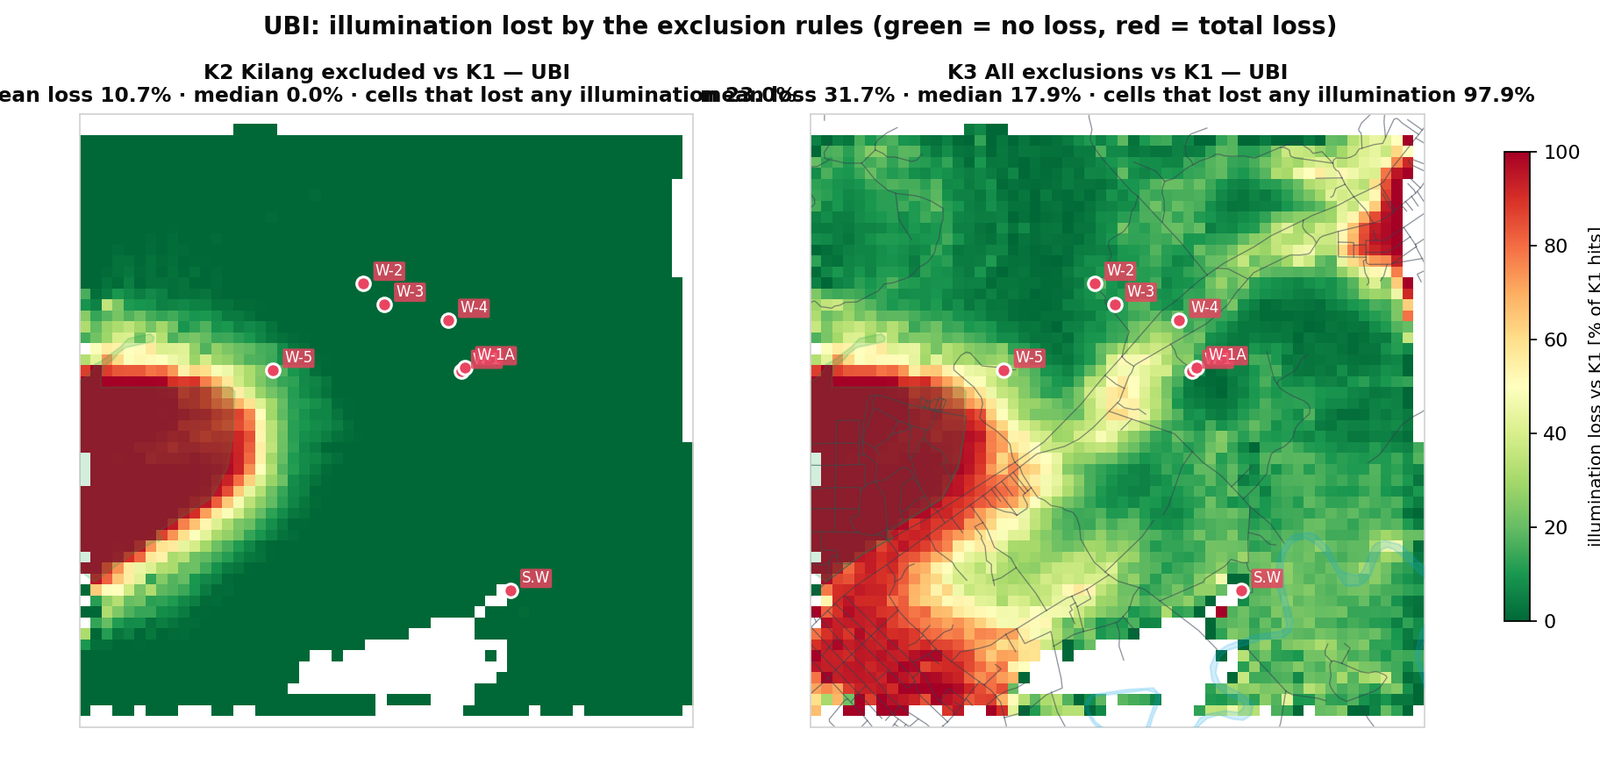
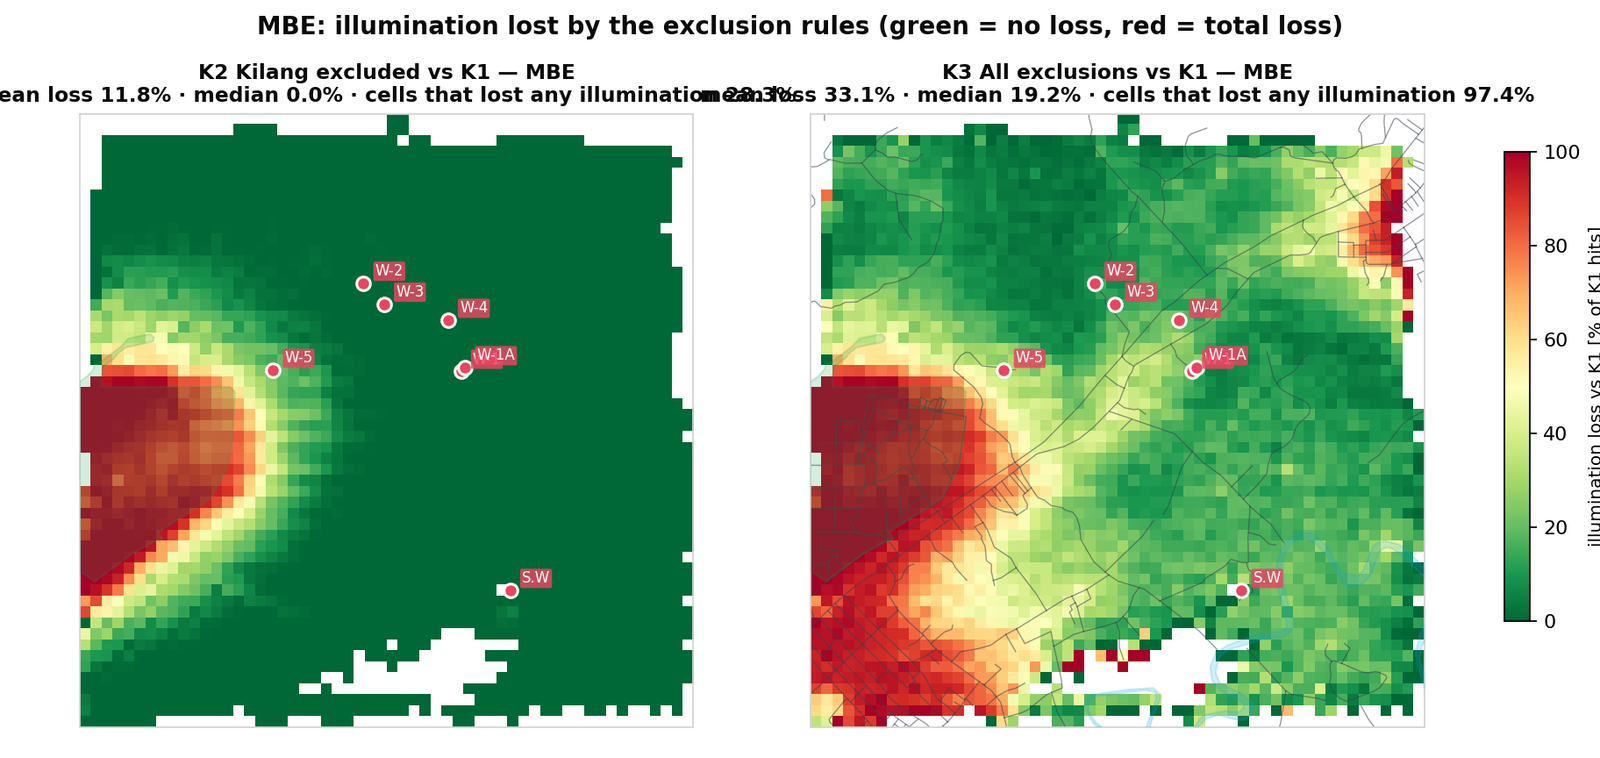
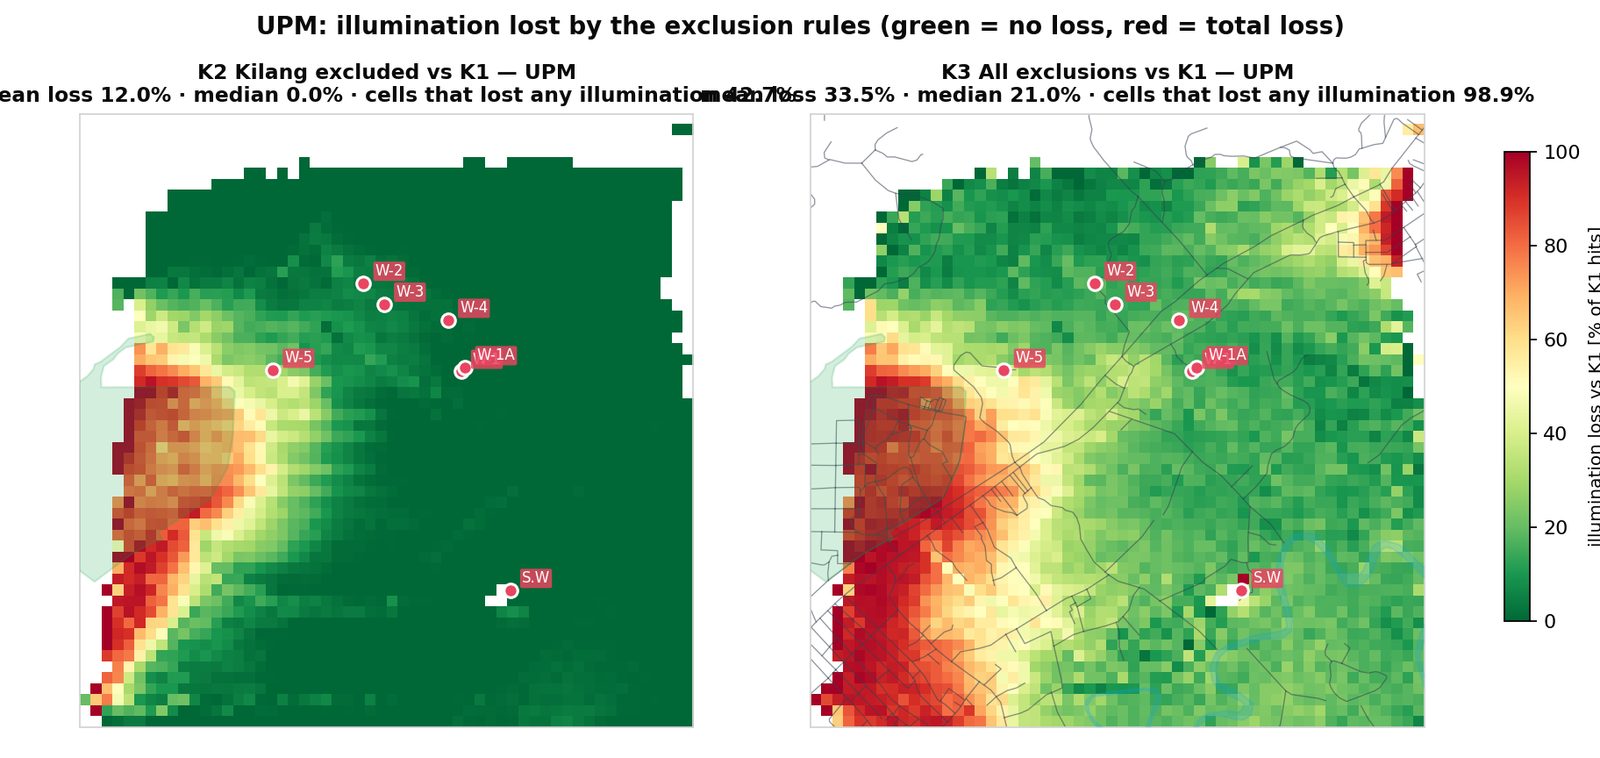
The cost, side by side
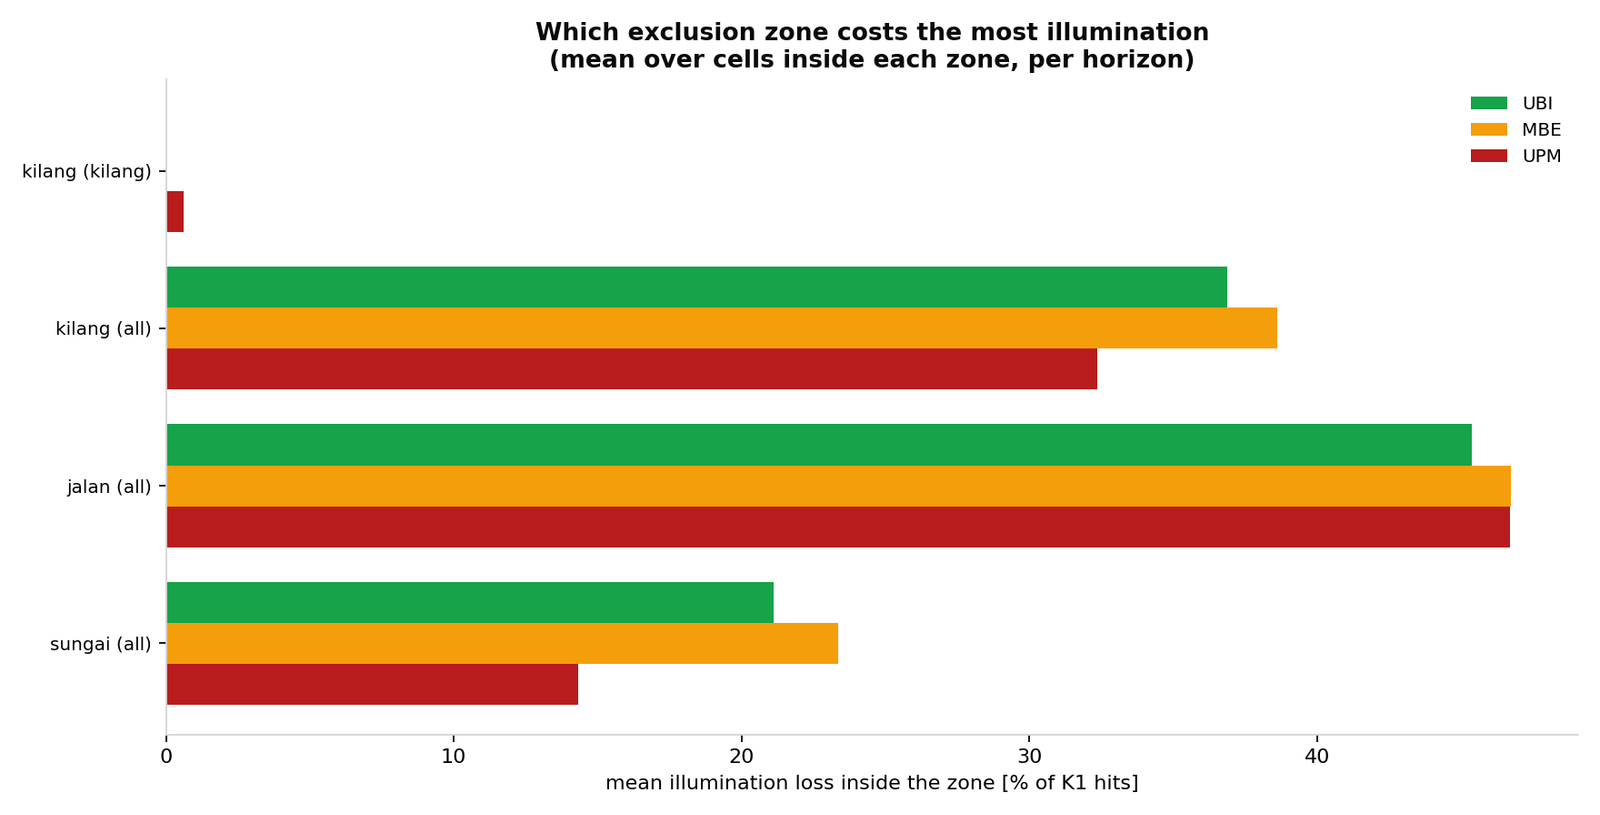
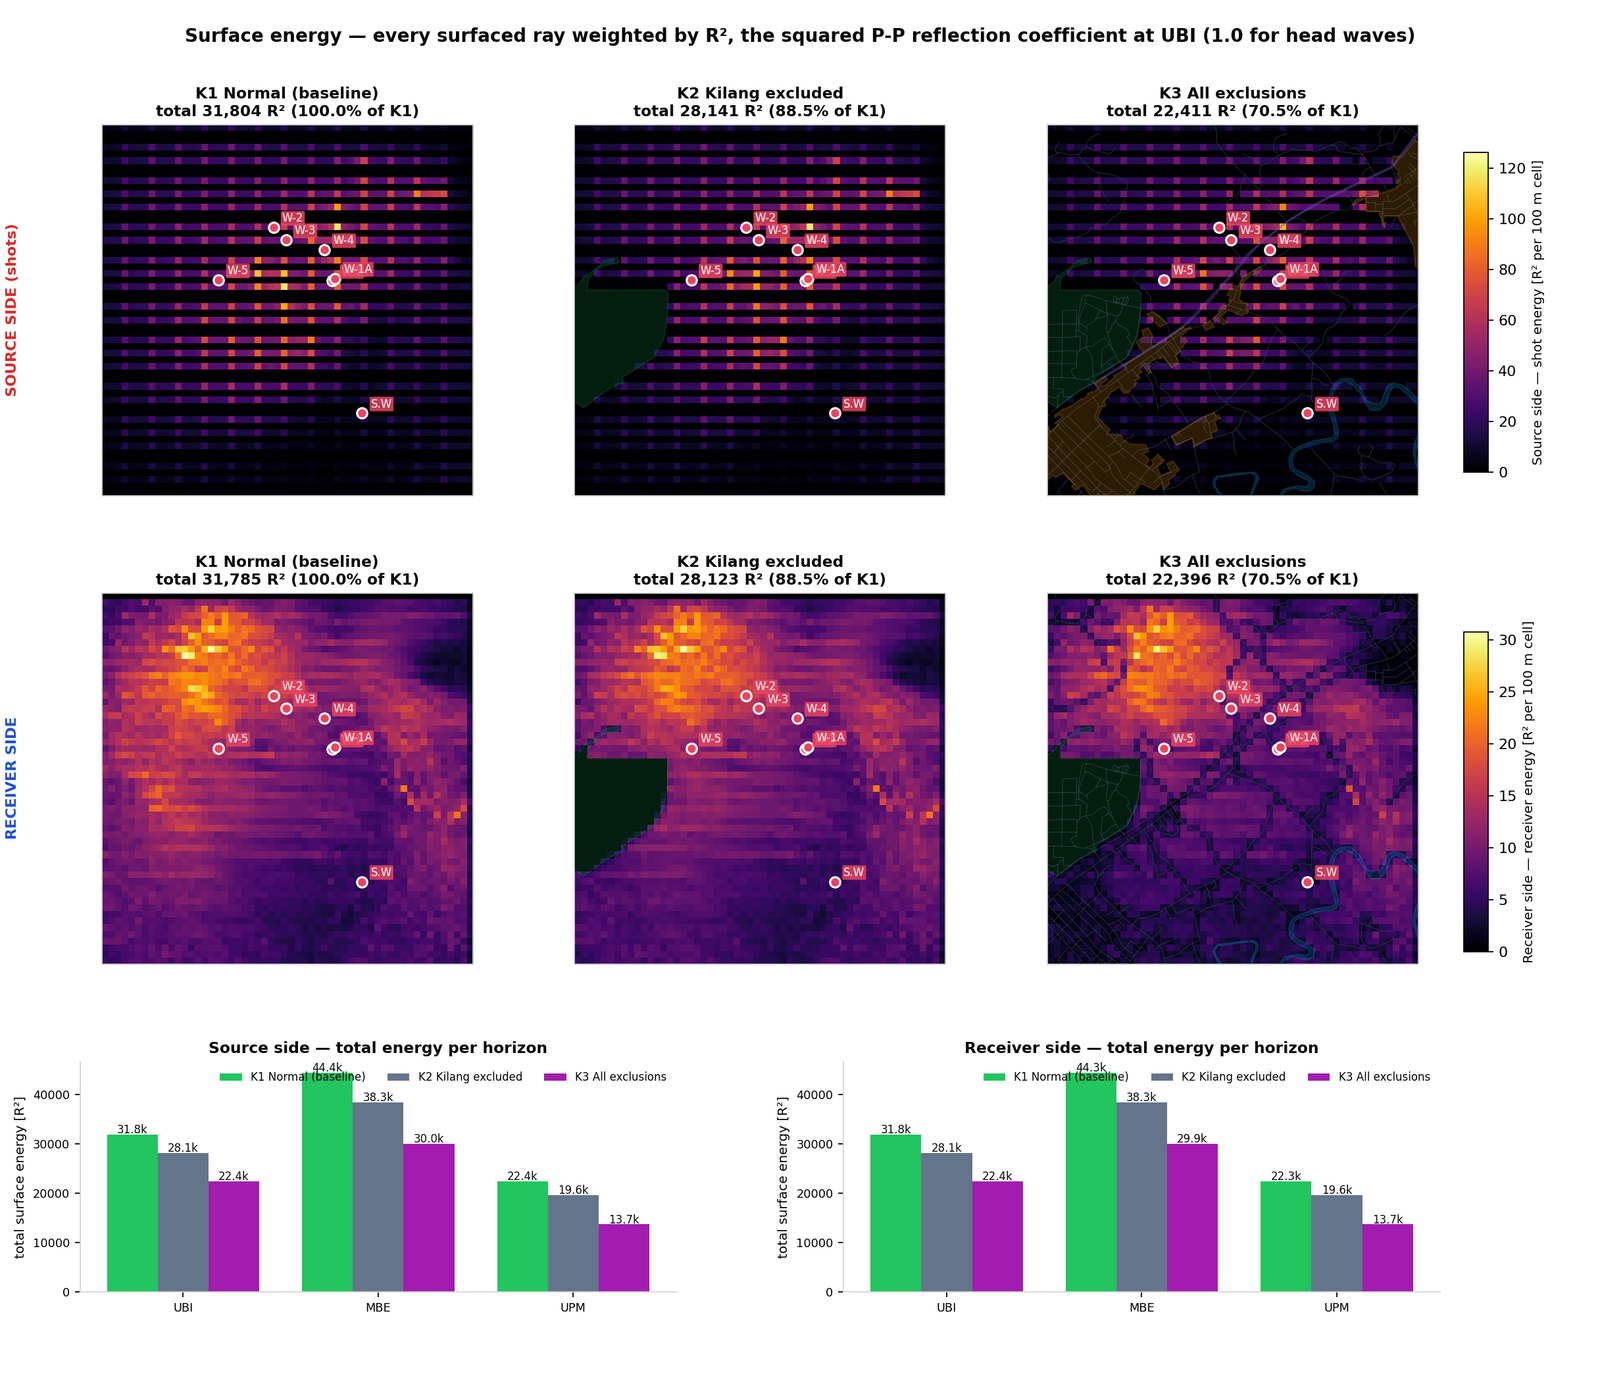
Surface energy — source side and receiver side
Every surfaced ray weighted by R², the squared P-P reflection coefficient at UBI (1.0 for head waves). Maps: UBI, 100 m cells. Bar charts: totals per horizon, both sides.