BTW 3D Land Seismic Survey — Target Illumination & Surface Sensitivity
P-P ray tracing through the MBE / UBI / UPM horizon model to answer three
questions: can the three target horizons be imaged with the current
acquisition parameters, which parts of the ground surface actually carry
the energy, and what should be changed. Every number on this page comes
from an independent ray tracer validated against closed-form Snell
solutions — no NORSAR involved.
3 horizons illuminatedSnell validated < 0.3%UTM grid 20 mP-P specular reflectionNORSAR IMAP unavailable on this machine
loading illumination grids…
MAPInteractive illumination viewer
Switch target horizon and attribute; the overlay is drawn from the same
ray-traced data as the tables below. Hover the map for the value at the
cursor. Use the horizon-depth contour and the acquisition lines to relate
the target-domain result back to the ground layout.
View
Target horizon
Attribute
UnitValue range
Colour ramp
Overlay opacity
Two maps at once
Blend
How to read a blended colour. The receiver map is
painted over the source map, and how far it reaches depends on the
receiver energy itself. Any magma you can still see is
source energy the receiver map is not covering. Two ramps
mixed at low opacity always produce a colour that belongs to
neither, so read the numbers from the cursor readout and the two
bars below the map, not the blend.
Layers
Real-world location. The coordinates are UTM zone 50 S.
With the southern-hemisphere false northing removed they resolve to
1.32° S, 116.71° E — East Kalimantan,
in the Sanga-Sanga / Kutai Basin area, which is where every reference in
the local library points. The satellite imagery underneath is therefore
a genuine geographic basemap, not decoration.
One caveat on the zone. Zone 50 is an
inference, not a given. It is the only zone consistent with the
reference library, and it places the survey centre within about 650 m of
the Wailawi field coordinates in wailawi.md. Confirm it with
the survey team before the GeoJSON is used contractually.
00
00
move the cursor over the map
—Study at a glance
1Can the three horizons be imaged with the current parameters?
This is the core question. The short answer is that all three horizons are
geometrically well covered, but they fail for different reasons,
and the failures are not the ones a fold map alone would reveal.
Per-horizon verdict and what to do about it
Generated from the measured statistics, so these statements
change if the ray tracer is re-run on a different geometry.
What each number means, and what it is for
Coverage
Percentage of map cells on the
horizon that receive at least one ray leg. It answers can I see
anything here? — the binary question that decides whether a
structure is present, absent, or merely unsampled.
Offset distribution
Source–receiver separation
actually sampling the horizon. Offsets set dip resolution, determine
whether NMO stretch is tolerable, and control what is available for AVO
and multiple suppression.
Incidence angle
Angle from the horizon normal.
Beyond the critical angle the reflection stops propagating as a body wave
and becomes a head wave with different kinematics and moveout.
Aperture (CRP–CMP)
How far the reflection point sits
from the source–receiver midpoint. Large aperture on a deep cell
means near-offset illumination only — weak stack, poor dip
resolution, poor stacking suppression.
Azimuthal concentration R
R is the length of the mean
unit vector of the reflection azimuths in a cell:
0 = perfectly even azimuthal spread, 1 = a single
dominant azimuth. High R is a directional shadow that no amount
of extra fold fixes if the geometry is unchanged. Cells with very few
rays always score near 1, so read R together with the hit count.
Reflection coefficient R²
The actual energy returned at each
angle. For a velocity increase the coefficient rises with
incidence angle, so illumination cannot be ranked by ray count alone.
Where the energy-weighted statistics live
Coverage and ray count treat every ray as equal. They are not. For the BTW
stack each horizon has only a small P-P reflection coefficient — the
velocity steps are 500 m/s across contrasts of 2000–3500 m/s,
so R² is of order 1–2% at normal incidence. The consequence is that
illumination is weak everywhere and the practical question is not
"is this cell covered" but "how does coverage vary relative to its
neighbours". That is what the difference maps and the surface sensitivity
analysis are for.
A real limitation of this study. The model is a
laterally-varying layer cake with constant velocity inside each layer. It
contains no lateral velocity gradient, no fault velocity anomaly, and no
anisotropy. Illumination around faults will therefore be smoother in this
model than in reality: real faults deflect and focus rays, producing shadow
zones and bright spots that a ray tracer cannot invent from horizon shape
alone. The fault-related structure visible in the aperture maps should be
read as a lower bound on the contrast that will be seen in the
data.
2Which parts of the surface actually control the image?
The viewer has an Illumination / Surface energy switch.
The surface mode answers the inverse of the usual question: instead of "what
does the target see", it asks "from where on the ground does the useful
energy arrive, and where is it recorded".
How to read the two surface maps
Source-side energy delivery
Sum of reflected energy launched from each surface cell
across all three horizon, weighted by the reflection coefficient. Because
rays spread as they travel down, this map is the direct measurement of
where on the ground you must shoot for the target to be lit.
Bright patches are places where source effort buys the most image.
Receiver-side energy capture
The same energy, arriving at the surface. This is where
you must plant geophones. Where the receiver map is bright but
the source map is dim, the ground is contributing recording aperture
rather than excitation — usually the better place to spend cable,
because receiver density is the cheaper of the two.
A trap worth naming. A "source energy share vs receiver
energy share" number is meaningless here: every ray contributes its full
energy to both maps, so the split is trivially 50/50. The useful statistics
are the concentration of energy over the active area and the
local ratio between the two sides. Those are what the table above
reports.
Practical reading
Source lines are 40 m spaced but source lines themselves
are 240 m apart. Source energy therefore arrives in stripes.
Any structure illuminated mainly from a shot direction will show a
240 m-period amplitude modulation unless the receiver spread spans
several shot lines.
Receivers are twice as dense as sources (20 m vs
40 m). Receiver-side energy is correspondingly more concentrated per
unit area. This is why the receiver map is usually the better guide to
where to spend cable budget.
Both maps go to zero at the survey boundary. That is
the acquisition footprint, not a modelling artefact, and it has to be
inside the final processing area or the edge will migrate badly.
3Anomalies and problem zones
An anomaly here means a place where the illumination departs from the
surrounding pattern in a way that will show up as a problem in the
migrated section. They fall into a few recognisable families.
A — Fold collapse when the active channel count is reduced
The most consequential finding in this study, and the one
that has no equivalent in the local reference library.
Coverage barely moves when the active patch shrinks, but the fold proxy
falls by roughly 90%. The area stays illuminated while the signal-to-noise
collapses. Reducing live channels does not reduce cost proportionally to
what it does to image quality: the first line removed costs far more
amplitude than the tenth. Note also the local reference
110318_KLO Sepinggan deck, which states that the number of receiver
lines in the patch has no significant impact once you are above two lines
— that is about azimuthal coverage, not about fold, and the
two must not be conflated.
B — Aperture anomalies aligned with UPM faulting
Switch the attribute to Max aperture on the UPM
panel. Bright linear features appear that trace horizon structure rather
than acquisition geometry. These are the shadow-side and flank zones where
the reflection point is far from the source–receiver midpoint.
Structure mapped along them will have systematically lower fold than
structure in the dark background, and the difference will be interpreted as
amplitude.
C — Offset overrun at depth
The design rule of thumb is
Xmax ≈ target depth, with the far offset small enough
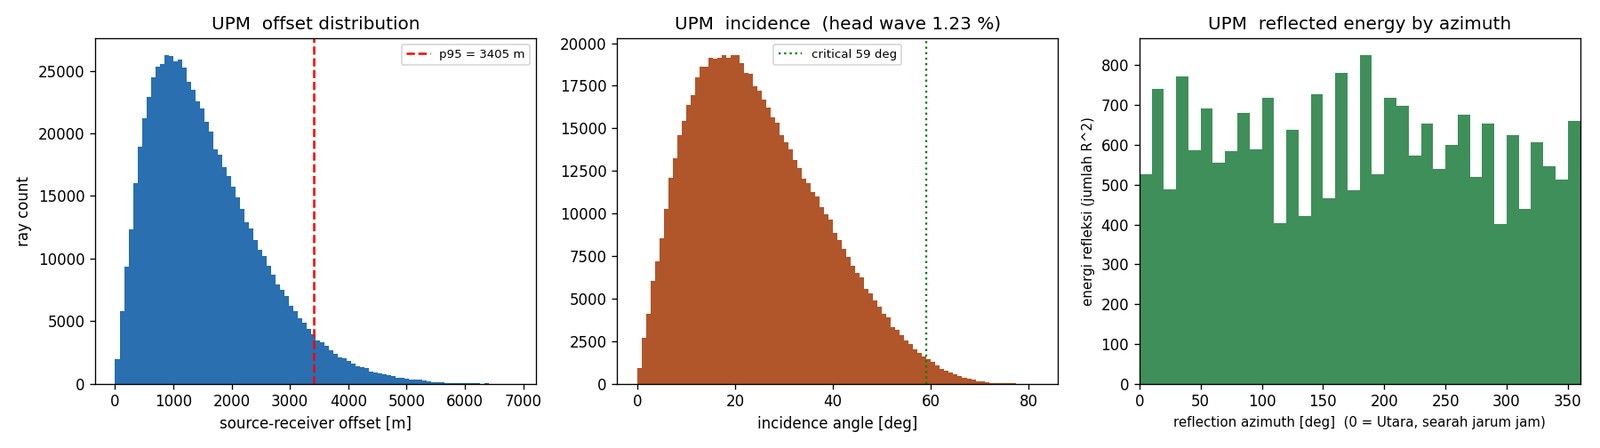
that NMO stretch stays tolerable. The UPM panel shows the median offset and
the 95th percentile; a p95 that sits well beyond the target depth means a
substantial part of the recorded energy is arriving at angles too steep to
stack cleanly. Those rays inflate the offset histogram without contributing
usable stack.
D — Head-wave contamination
Each horizon has a critical incidence angle
(asin(vabove/vbelow); for UPM that is
asin(3000/3500) = 59°). Rays steeper than that do not propagate as
body waves. The head wave share reported per horizon in the
stats figure is the size of this problem. A low percentage means
the illumination is dominated by genuine body-wave reflections and the
depth image can be trusted.
E — Near-offset pile-up
The take-off fan is sampled uniformly in
tanθ, not in θ. That deliberately spreads the rays
more evenly in offset space, because a receiver spread is uniform in
distance. If you ever need a genuinely uniform angular sampling instead
(for example for angle-domain imaging), change takeoffs() and
the results will shift.
F — Edge and taper artefacts in the fold map
On the 100 m grid the fold map shows vertical striping.
That is aliasing: the shot interval is 40 m and the cell is 100 m,
a ratio of 2.5, so the sampling pattern beats against the grid. It is a
display artefact, not physics. Use the 200 m grid for any fold-based
judgement.
What the constraint zone costs in fold
Every illumination number in this study was computed twice: once with the
whole survey active, and once with the constraint zone taken out of the
template. The difference is the price of the constraint, and it is a much
smaller bill than the fold collapse described in item A.
The measurement itself, the baseline map, the difference map and the summary
are collected in Part 10, Fold analysis.
4Acquisition geometry on the surface
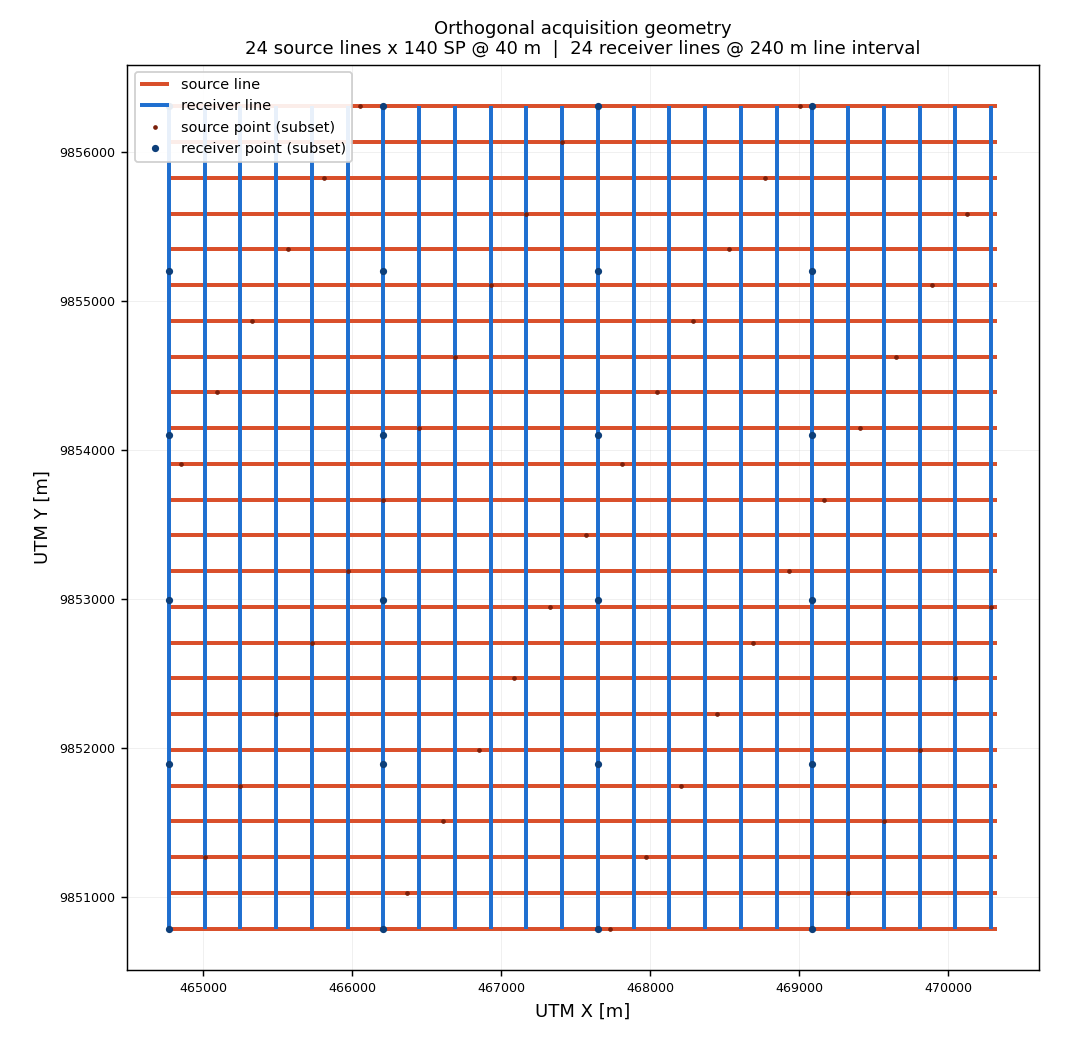
The orthogonal layout the illumination results are based on: source lines
running along X, receiver lines running along Y, so every shot has a
perpendicular receiver spread.
Figure 1. Orthogonal acquisition geometry.
Red = source lines (running along X), blue = receiver lines (running
along Y). Source points are spaced 40 m along a line and the lines
are 240 m apart; receivers are spaced 20 m with lines 240 m
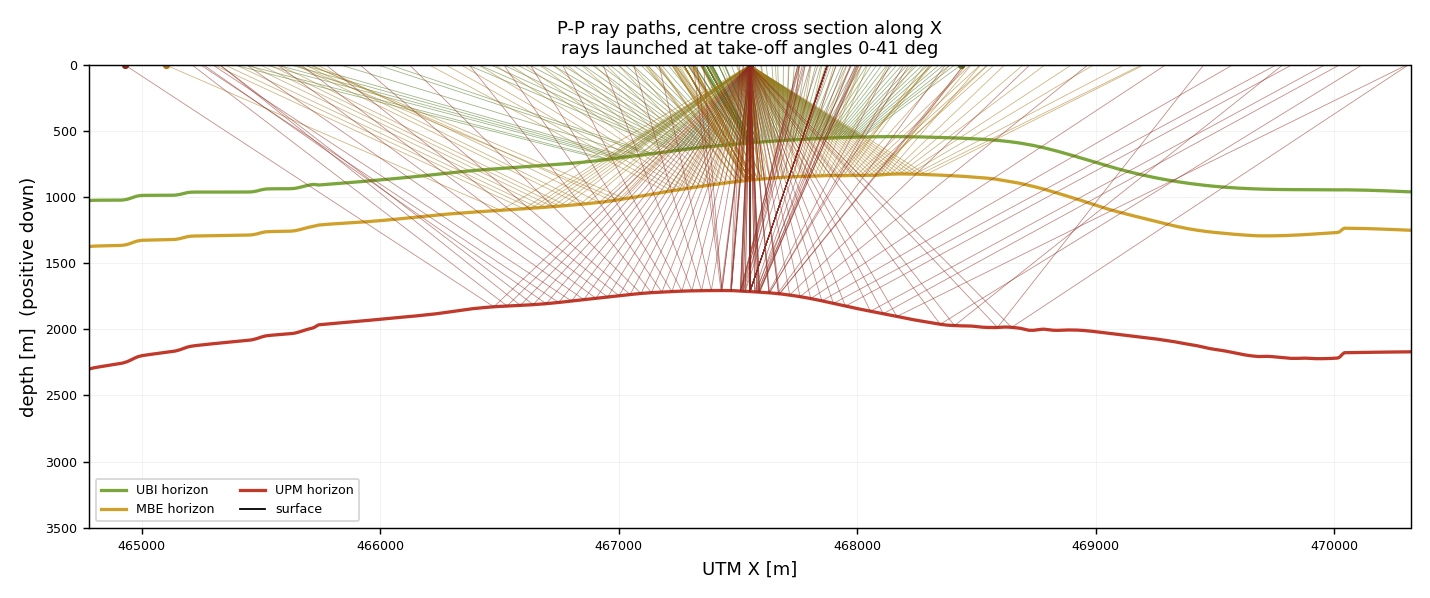
apart. Every source line crosses every receiver line.Figure 2. P-P ray paths through the centre
cross section. Green = UBI reflection, gold = MBE, red = UPM. Note how
the deep reflections travel much further horizontally before returning
— that is the reason the deep target needs far more offset than the
shallow ones.
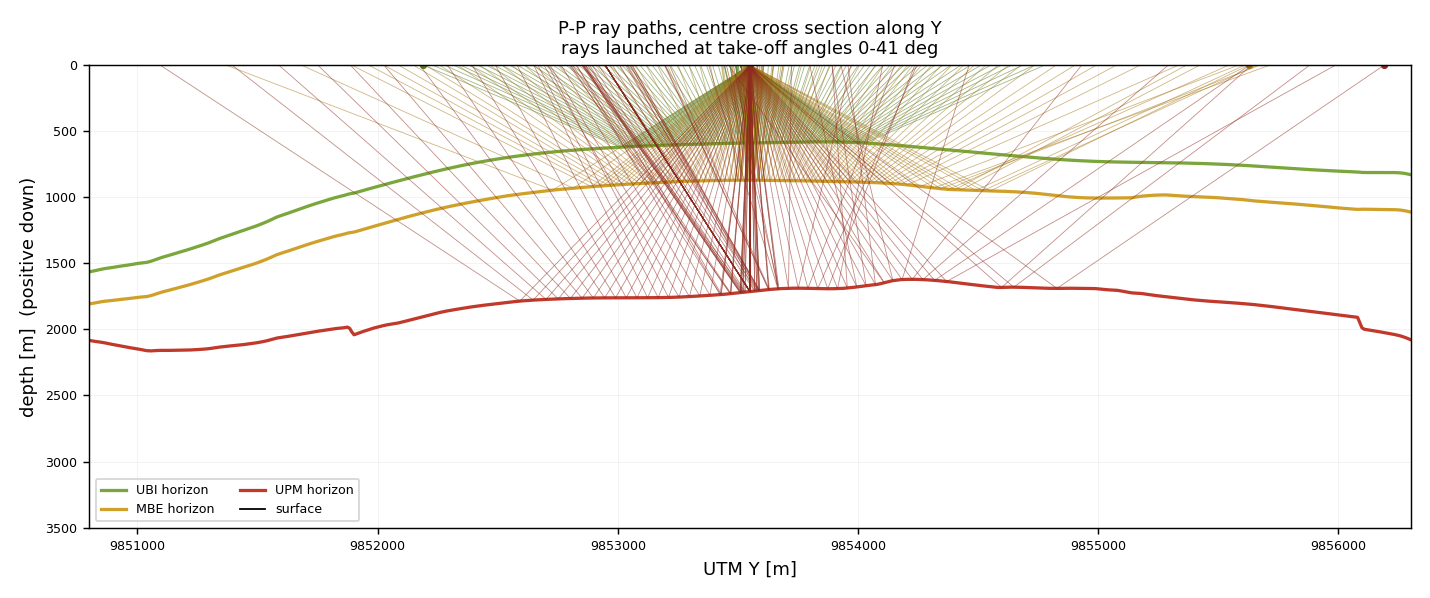
Figure 3. The same rays in the Y direction.
Comparing with Figure 2 shows how strongly the illumination is
anisotropic with depth: at UPM depth the ray bundle is stretched far more in
one horizontal direction than the other, because the deeper horizons are
crossed at more oblique angles.
Nominal fold, and the integer-fold trap
Using the Cordsen et al. (2000) formulas for an orthogonal template,
in the GPS form given by IFP/OGST (2006):
Note the two factors of spacing in the crossline term. The inline fold is set
by how many receiver spacings straddle the source, so it divides by the
source point interval along the line, not by the line interval; the
crossline fold then multiplies the ratio back, which is why enlarging the
template without moving the source points makes the data worse, not better.
Cordsen et al. also warn that the inline and crossline folds
should each be an integer, because a fractional value produces
a beat between the two sampling directions that shows up as amplitude
striping in the migrated section. This is a cheap check to run before any
ray tracing at all, and it is reported in the "at a glance" cards above.
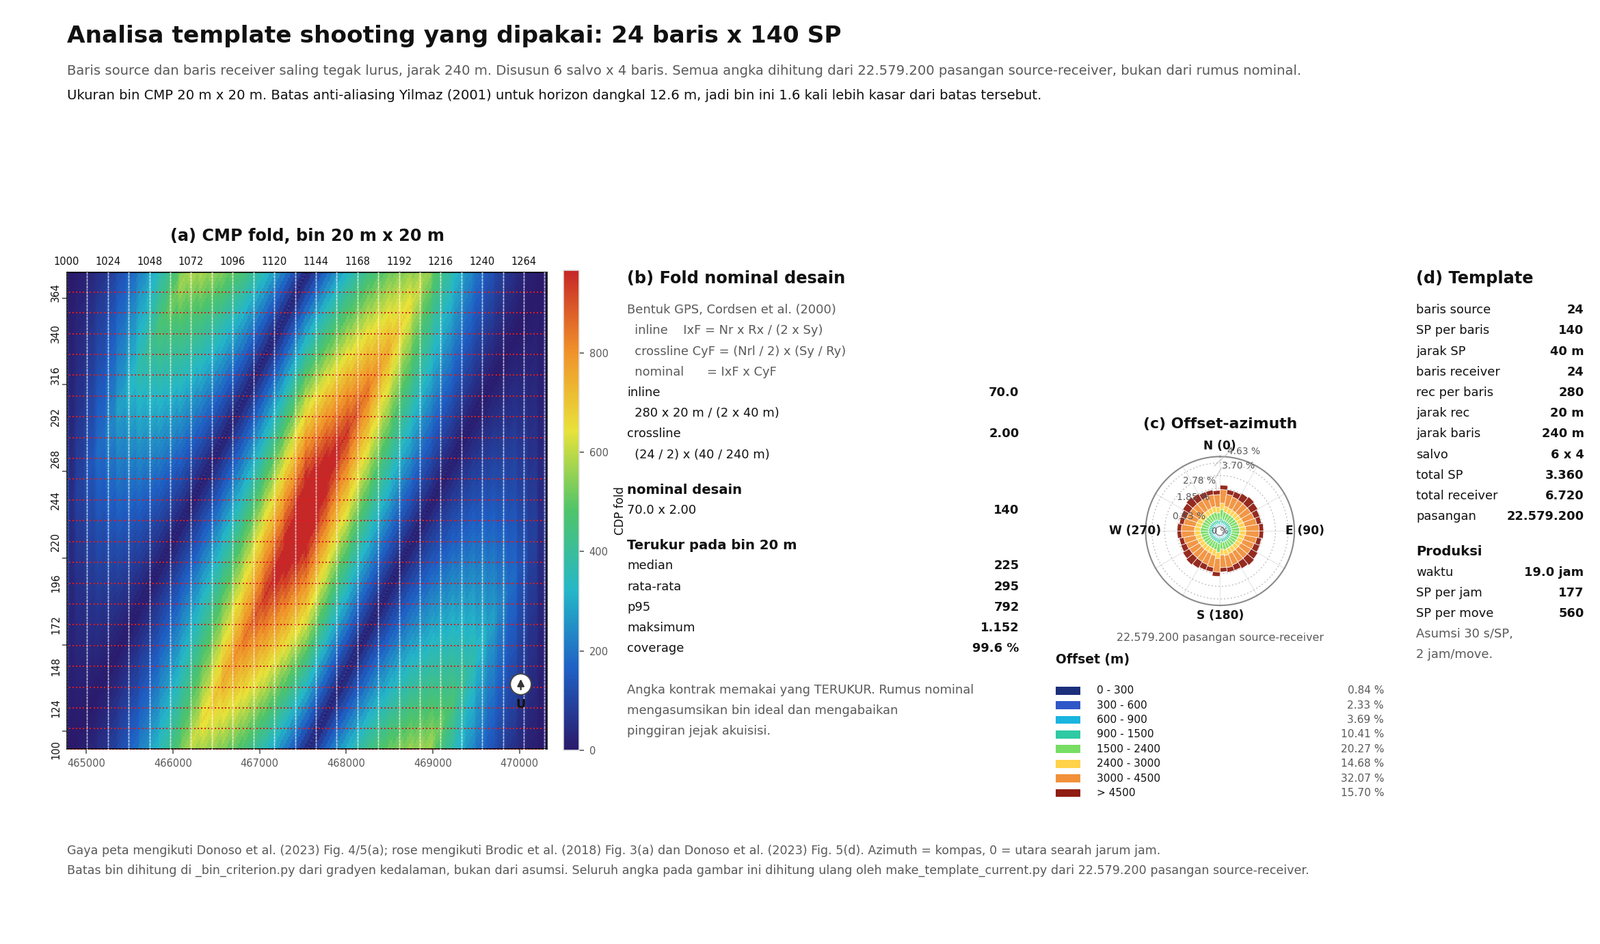
The two fold numbers are not interchangeable. The nominal value of 140
assumes an ideal bin and ignores the ragged edges of the acquisition
footprint, so the measured median of 225 and 95th percentile of 792 are the
numbers to quote to a client. Everywhere in this study the measured value is
the one used. The template map, the full derivation and the offset-azimuth
rose are in Part 10, Fold analysis.
Practical geometry checks worth running before anything else
Inline fold integer test. Adjust the source-point
interval until N_rcv × d_rcv / (2 × d_SP) is a
whole number.
Xmin test. The largest nearest-offset in the survey
should be below 1.0–1.2× the depth of the shallowest
target, otherwise near-offset stacking fails on the shallowest event.
Xmax test. Far offset ≈ deepest target depth.
Beyond that the stretch mute removes the data anyway.
Migration aperture test. Radius needed to capture
diffracted energy at 30°, i.e. Z × tan(30°)
≈ 0.58 × Z. The survey must be that much wider than
the mapped area on every side.
Footprint budget. Survey area must exceed mapped
area by the fold-taper plus the migration radius. In the Sepinggan case
study the full-fold area was 213 km² against a 54 km²
image — a 4× ratio.
5What the literature says should be checked
Two sources were consulted: the 28 papers in the local
references\ folder, and published work on illumination
studies. Both agree on the physics; they disagree, usefully, on the
geometry.
From the local reference library
Reference
Setting
What it contributes
Bi_objective_optimization Monsegny et al.
Synthetic 2D, curved reflector 0–90°
Ray-based design by bi-objective optimisation. A 15-shot optimised
survey gave no less detail than a full 1000-shot survey —
because placing sources and receivers where specular rays emerge beats
the conventional CMP assumption. The CMP assumption (that S/R sit only
above the target) is invalid for steep or curved targets.
110318_KLO Sepinggan
Marine 3D, 411 km², targets 404–3461 m
The most quantitative illumination study in the library. Wide
azimuth (aspect ratio just above 0.66) matched full-azimuth coverage:
83.8% shallow / 61.9% deep versus 70% / 54.4% single-azimuth. Max offset
6000 m set by a 50° incidence target; migration aperture 3400 m
(75%) dropping to 2300 m in the south; Xmin = 283 m at 250 m
line interval.
3D_Walio
Offshore, ~100 km²
The one direct geometry comparison in the library: rose-fold peak
20,942 orthogonal vs 24,475 diagonal at identical
channel count. Diagonal won on azimuthal fold.
105_acq_design_philo
Land / transition / marine
Builds its whole feasibility loop around diagonal-versus-orthogonal
comparison, using 3D ray tracing + 3D DMO. Marine infill typically 20%,
locally up to 50%. Acquisition footprint from 3D DMO is called "a
serious drawback".
IPA22-G-231
Land, deep fractured basement
Closest local precedent for a sparse land design:
RL 400 m, SL 500 m, receiver 20 m, shot 40 m, offset
22.5–3366 m. Notably, no illumination analysis was
performed — exactly the gap this study fills.
IPA12-G-168 Handil
Land / transition / shallow water
192 receivers @25 m, fold 96, bin 12.5×12.5 m, 3072
active of 4000 phones. Shows the practical active/available ratio that
access constraints force.
IPA09-G-035
Land CBM
The dissenting voice: argues finite-difference modelling is more
robust than ray tracing in complex media, because ray tracing "suffers
due to its reliance on Fermat first arrival". Worth taking seriously for
the shallow land section.
ipa03-g-099 Kalimantan
Land to marine, 220–370 km²
NORSAR TM ray tracing described as "particularly effective in
simulating the merge zones" between land and marine methodologies
— the closest reference to the original intent of using NORSAR
here.
The most methodologically useful document in the
library: a full survey design report that derives each number
rather than quoting it. Maximum offset from the stretch mute,
not a depth rule: the CDP mute at 1800 m offset sits between 600 and
800 ms, extrapolating to ~3000 m usable offset for the deepest target.
Migration aperture d = Z·tan(θ) at 30°
gives ~1800 m at 3000 m depth. Bin size floor from
ΔX ≥ V/(4f√2)·sinθ/sinβ:
63 m at 50 Hz / 3300 m/s / 15° dip. And for 3D, a 25×12.5 m
bin at 25 Hz needs only fold 10 for 2D-equivalent SNR — but
the report then argues that fold is too low for prestack migration and
AVO, so the real requirement is higher. It also states plainly that
"some compromise between the desire to record near offset data and to
record all azimuths cheaply needs to be reached" — the same
tension measured in section 8.
An interpretation paper, not a design one — no
acquisition parameters. Its value here is as a regional tie:
three horizons picked at 940, 1610 and 2070 ms TWT across the two lines,
in the same basin as this survey. At a nominal 2000 m/s those
correspond to roughly 940 m and 2070 m depth, which is a
useful independent sanity check on our UBI (~920 m) and UPM (~2000 m).
wailawi
IPA field card, Wailawi, East Kalimantan
Not decision-relevant to survey design
— it is reservoir and production data. It earns its place for one
reason: it fixes the well location at 01° 19′ 19″ S /
116° 42′ 51″ E, which is what let us detect that the
UTM inversion had dropped the southern false northing. That bug put the
survey at 88° N on the website; correcting it places the survey
centre within ~650 m of this field.
All 28 documents in references\ have now been read: the three
that were originally scans without a text layer
(KEI-FM-06G-12-17-018, Layout_Asrim_2023_com,
wailawi) were OCR'd and are covered in the table above.
From published illumination practice
Standard illumination attribute set
Across the published work the attributes are always the
same list: fold from the number of rays per CRP bin, offset and
azimuth distribution measured at the target rather than
at the surface CMP, plus minimum and maximum offset and reflection
amplitude density. The CRP-versus-CMP distinction is the important one:
a survey can look perfectly uniform at the surface and be badly shadowed
at depth.
Orthogonal is described as the land default because
parallel geometry is inefficient on land, and a brick template is
preferred when near-offset AVO matters or the shallow section is
heterogeneous (it costs 10–15% more in layout effort). But the
CREWES slant-geometry study found slant better for one target and
orthogonal better for another, with the deciding factor being the
offset distribution for data inversion. The honest summary:
there is no universally best template, and the decision has to be made
against a specific target.
The rules that recur, and that can be checked
immediately on this design:
Xmax ≈ target depth
Xmin < 1.0–1.2 × shallowest target depth
migration aperture ≈ Z × tan(30°)
bin size from max frequency and velocity
inline and crossline fold should both be integers
"at least 4-fold is sufficient for mapping horizons" — the
minimum to see something, not to image it well
The gap this study sits in
No paper in the local library reports an illumination or
fold pass/fail threshold — coverage percentages are quoted without
saying what is acceptable. No land orthogonal 3D case study in the library
documents an illumination analysis at all; every real illumination study
there is marine or synthetic. And nothing quantifies fold loss
against the number of active receiver lines, which is precisely the
decision in front of this project.
Ordered by how much they change the image relative to what they cost.
The first three are free.
1 — Run the integer-fold test before anything else
Free, and it costs only a change of geometry. A
fractional inline or crossline fold beats against the other sampling
direction and produces amplitude striping that will be blamed on the
subsurface. Test N_rcv × d_rec / (2 × d_SP) for
inline and (N_rl / 2) × (d_SP / d_rl) for
crossline, then adjust the point interval until both are whole.
This template already passes: inline fold 70 and crossline
fold 2.00 are both integers, giving the 140 nominal fold. The check is still
worth running, because it must be settled before any ray tracing is
commissioned — it changes the geometry the tracing is done on.
2 — Do not cut the active receiver spread to save money
This is the direct answer to the measurement above. Cutting
to a small active patch leaves coverage essentially untouched while
removing most of the fold. The money saved is spent on cable and nodes
that would have bought SNR; the image comes out noisier for the same
nominal fold. If the budget forces a reduction, take it out of line count
at the survey edge (where the taper is already dead) rather than out of
the active spread behind every shot.
3 — Judge fold on the 200 m grid, never the 100 m grid
Free. The 100 m fold map is aliased by the 40 m shot
interval and will mislead any fold-based commercial decision.
4 — Weight the illumination by the reflection coefficient
With R² of order 1–2% across this stack, geometric ray
count is a poor proxy for usable signal. Add the R² weight to the
illumination attribute set before comparing design options. Note that for a
velocity increase the coefficient rises with incidence angle, so
the steep rays that look worst on a fold map are not necessarily the
weakest contributors.
5 — Test the diagonal template before locking the geometry
The Walio reference found diagonal beating orthogonal on rose
fold (24,475 vs 20,942) at identical channel count, and the CREWES study
found the deciding factor to be the offset distribution for inversion. Both
are one extra ray-trace run away, and the tracer here already supports it:
rotating the take-off fan by 45° reproduces a diagonal-shooting
template. For a faulted target where azimuthal balance is the point, this
is the single highest-value experiment left.
6 — Re-check the far offset against NMO stretch at the real target depth
The UPM panel reports a p95 offset that sits beyond the
target depth. If that is confirmed against the actual velocity model rather
than the layer-cake approximation used here, cap the far offset and recover
channels rather than recording data that the stretch mute will discard.
7 — Model the faults, not just the horizon shapes
This study can only show illumination variations caused by
horizon geometry. Real faults deflect rays and will create shadow zones
beyond anything here. Before signing off, build a velocity model with
explicit fault velocity contrasts and re-run. The aperture map already
flags where to put them: along the bright linear features.
8 — Get the NORSAR licence question resolved, separately
The Failed mapping surface failure is an
environment problem, not a survey problem: an evaluation build with 8 GB
RAM ran job 0 successfully and jobs 1–11 at 0%, with 6.4–7.2 GB
of swap in use. Direct ray tracing (dirP) worked, which
localises the fault to the surface-mapping stage. Nothing in the design
should wait on it — but if NORSAR is to remain the operational tool,
the licensing and memory questions need an answer, because the IMAP
workflow cannot be relied on for acceptance work in its current state.
75D interpolation feasibility
5D interpolation reconstructs seismic samples on a regular grid using
all five dimensions of the data at once: inline, crossline, offset, azimuth
and frequency. The question this section answers is whether the geometry of
this survey can support it — and the answer can be produced
before acquisition, because every input is a coordinate, not
a recorded sample.
An honest correction to how this is usually stated. It is
widely implied that 5D feasibility is "explicitly supported at the survey
planning stage". We could not find an authoritative source that says that,
and we are not going to repeat it as if it were established. What
is true, and what this page actually demonstrates, is narrower and
stronger: the measurement itself is available at planning stage,
because it depends only on the acquisition geometry. The 5D literature
frames its target geometry relative to the acquisition design
(Robertsson et al. 2009) but does not present a planning-stage
feasibility test.
What 5D actually requires
The canonical definition is Robertsson et al. (2009): interpolation
performed simultaneously in inline, crossline, offset, azimuth,
frequency. The same paper is unusually precise about what governs
success, and it is not fold:
"The success of these methods depends largely on two factors: (1) having
efficient transform operators that permit the use of large multidimensional
windows (2) constraining the spatial spectrum along directions where the
seismic amplitudes change slowly, so that sparseness and band limitation
assumptions remain valid."
Robertsson et al. 2009, Geophysics 74(6) V123
— doi:10.1190/1.3245216
This matters for how the numbers below should be read. 5D interpolation is a
spectral sparseness argument, not a fold-count argument. A survey
with high fold but rapidly varying amplitude along one dimension is a poor
candidate; a moderate-fold survey that varies smoothly is a good one. So
the useful screening metric is not "how much data is there" but "how
smoothly is the data spread across the offset–azimuth plane".
Why an orthogonal template is the right target
5D methods split into surface-consistent (interpolating onto a grid
of source and receiver lines) and subsurface-consistentsurface-line 5D interpolation, which bridges the two and is
explicitly defined on orthogonal geometry:
"The target grid in this case is composed of both CDP bins as well as source
lines and receiver lines for an orthogonal survey. This is
sufficient to maintain surface-consistency, while also focusing on a
subsurface CDP grid."
Ursenbach, Ong & Wilkinson, IMAGE 2024, pp. 2435–2439
— doi:10.1190/image2024-4101457.1
This is the single strongest positive finding for BTW. The survey is
orthogonal by construction — 24 source lines along X, 24 receiver lines
along Y, every source line crossing every receiver line — which is
precisely the acquisition that surface-line 5D is designed for. The method
also preserves source and receiver identity, which matters when the
same acquisition has to stay usable for conventional processing.
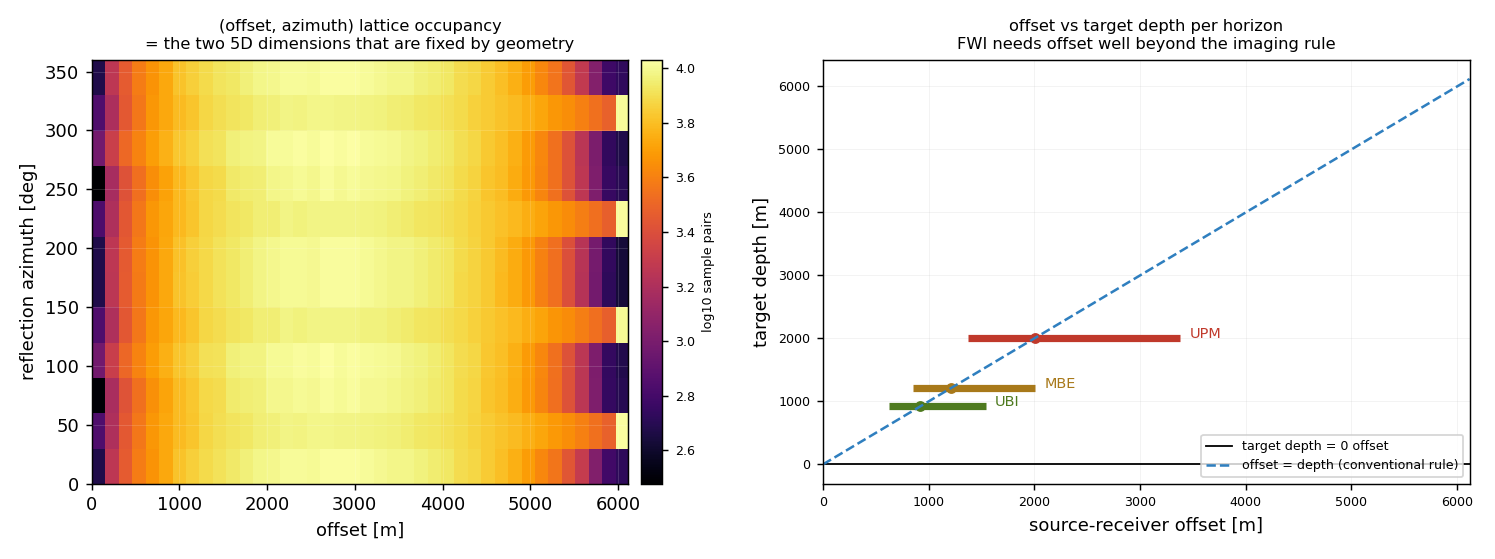
Figure 4. Left: the
offset–azimuth lattice, the two 5D dimensions fixed by
acquisition geometry. Every one of the
— cells is occupied, but the counts are
far from uniform. Right: measured offset against target depth for each
horizon, with the conventional Xmax ≈ depth rule
drawn for reference.
What the measurement says
Lattice fully occupied, azimuth complete.
All — offset–azimuth cells contain
samples and all — azimuth sectors carry data,
so there is no azimuth hole for the interpolation to invent across.
But the distribution is strongly peaked.
The coefficient of variation across occupied cells is
—. This is the number to watch: a lattice that
is fully occupied but unevenly filled still forces the algorithm to
extrapolate in the quiet sectors, and that is where 5D leakage
enters the result.
CMP coverage is good.— of the 25 m bins carry data at a median
fold of —.
Orthogonal geometry is a genuine advantage
for surface-line 5D specifically, and is the one design decision here that
is already right for this purpose.
The honest limit: 5D is preconditioning, not acquisition.
Cary & Perz (2012) define 5D leakage as "noise and possibly
signal not able to be correctly interpolated due to the fact that actual
data do not completely conform to the model used by the algorithm", and
show it can contain "complex (quickly varying) aspects of the data such as
noise, diffraction patterns and acquisition footprint". Their
finding is reassuring about the part that matters: "slowly varying signal
(especially reflections) are part of the measured data that appear to be
most important and can be reliably interpolated." The interpretation is
that 5D interpolation repairs the *regularisation* problem and cannot
manufacture data that was never recorded — a survey designed for 5D
and a survey designed only for 5D are not the same survey.
Cary & Perz, SEG 2012 —
doi:10.1190/segam2012-1368.1
Not addressed by the literature. The non-integer inline
fold of 11.46 flagged in section 4 is a real defect and should be
fixed, but we found no source that treats integer fold as a
precondition for 5D interpolation. It is flagged here as
unaddressed by the literature, not as assessed-and-acceptable.
8FWI readiness
Full waveform inversion fits a wavefield model to the recorded
waveforms, so it is sensitive to everything conventional imaging averages
away. The useful framing here is the one ACTeQ use: designing acquisition
programs that are fit for FWI while remaining compatible with
conventional imaging workflows, because abandoning the established
imaging requirements does not help either objective.
The reference, and a caveat. ACTeQ’s FWI design page
states that "the goal is not to abandon established principles. The goal is
to extend them", and argues that geometry should be "assessed against
inversion physics and intended depth range" rather than against inherited
rules of thumb. They specifically reject simple depth-ratio heuristics,
writing that this "moves beyond simplified heuristics such as maximum
offset divided by three", and use diving-wave analysis of
turning-wave penetration instead.
ACTeQ, Full Waveform Inversion Survey Design —
a vendor/consultancy source, not a primary reference.
What we could not verify. We found no authoritative,
citable numeric thresholds for FWI — no sourced minimum offset, no
starting frequency, no shot-density multiple over conventional
acquisition. Widely repeated figures such as "Xmax = 1.5 × depth"
for FWI did not survive checking, and the industry source above moves
away from depth-ratio rules rather than endorsing one. The numbers
in the table below are therefore our measurements of this survey,
not thresholds imported from a rule of thumb. The authoritative treatment
is chapter 6 of the SEG book on land and marine survey design
(DOI 10.1190/1.9781560803713), which is paywalled and was not
available to us.
What the geometry gives an FWI run
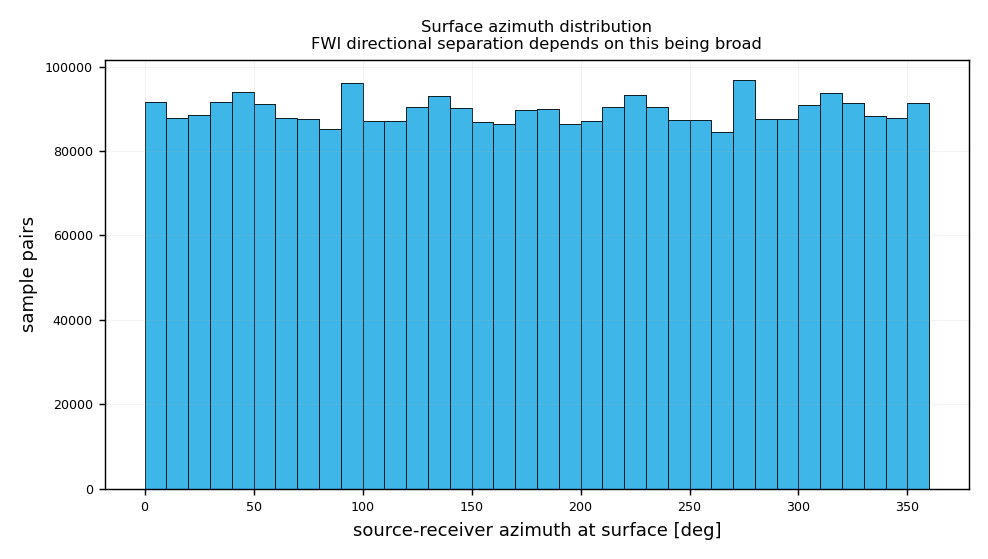
Figure 5. Source–receiver
azimuth distribution at the surface. FWI separates the wavefield into
directions before inverting, so the breadth of this distribution —
rather than its total count — is what determines whether there is
enough independent information to constrain a velocity update.
Azimuth is genuinely well spread.
Measured azimuthal concentration at the target is
—, and the surface azimuth histogram covers
the full circle. This is one of the strongest properties of this design
for FWI, and it is unusual for a land template — parallel land
geometries routinely collapse into a narrow azimuth wedge, which starves
any directional decomposition.
Median offset is light relative to depth.
The median offset sits near — of target depth
at every horizon, which is narrower than an FWI workflow would
ideally use. Reflection imaging is comfortable there; FWI generally wants
more of the wavefield illuminated.
Far offset is not the
constraint. Maximum offset reaches
—, comfortably beyond any depth-ratio
heuristic. This survey is offset-rich at the far end and offset-poor in the
middle-to-near range.
Low-frequency content cannot be answered from
geometry. FWI on land is dominated by whether a usable
5–10 Hz signal survives the near surface, which is a source,
receiver and ground-condition question. This study has no wavelet
information and does not guess at it.
Orthogonal geometry is compatible with FWI
but is not itself an FWI advantage. We found no source claiming
orthogonal templates either help or hurt FWI relative to other templates.
What the literature does support is that offset and azimuth regularity
matter, and this design has both.
Recommended FWI actions for this survey
Do not change the geometry yet. The
azimuth distribution, far-offset reach and CMP coverage all clear the
qualitative bars for an FWI-capable survey. The open questions in this
section are about frequency content and mid-range offset density, not
about the template.
Spend marginal budget on mid-range offset
density, not on more lines. The offset histogram shows where the
rays already are. Adding channels inside the populated offset band
directly increases the independent sample count that spectral-sparseness
regularisation depends on.
Treat the non-integer inline fold as a
blocker for both objectives. It affects conventional imaging and
would affect any offset-azimuth regularisation built on top of it. Fix it
at the same time as everything else in section 6.
Commission a diving-wave study before
fixing Xmax. Since ACTeQ's own recommendation is to assess
turning-wave penetration rather than apply a depth ratio, the right next
step is a turning-ray model at the real velocity function — which
this tracer can already run by extending the take-off fan.
Keep the design FWI-compatible, not
FWI-optimised. The same acquisition has to survive conventional
processing, demultiple and amplitude work. Design decisions should be
checked against both, as ACTeQ explicitly frame it.
9Method and validation
How the rays are propagated
Rays carry a slowness vectorp, not a
direction. The direction is always recomputed as
n = v · p, and the step length is
v · Δt. Snell's law is then automatic: the
tangential slowness is continuous across an interface and the normal
component is re-derived from the local velocity,
pz = ± sqrt(1/v² − px² − py²)
Getting that wrong is subtle and severe. Carrying p
across an interface unchanged gives |n| = v·|p| = 1.25
when a ray enters 2500 m/s from 2000 m/s — a ray moving
faster than the wave. Rays that exceed the critical angle become head
waves and are terminated rather than clamped.
Take-off angles stop at 41°, set by the deepest interface a ray
must cross: at MBE the critical take-off is
asin(2000/3000) = 41.8°.
Validation against closed-form solutions
Test
Worst error
Flat reflector, offset 2h·tanθ
0.000 %
2-layer Snell, 2Σti·tanθi
0.267 %
3-layer Snell
0.097 %
BTW velocity stack
0.082 %
Vertical-ray CRP depth vs horizon
0.000 m
The flat-reflector test passed on a version of the tracer that had the
interface bug, because a single-layer model has no interfaces to get
wrong. The layered Snell test is what actually caught it — error
was 87% before the fix. A test that cannot fail is not a test.
Key modelling assumptions
Velocity is constant inside each layer and depends only on depth
relative to the three horizons. No lateral gradient, no fault velocity
anomaly, no anisotropy.
Reflections are specular and P-P only. Converted phases are ignored.
Take-off directions are sampled uniformly in tanθ,
which spreads rays evenly in offset space rather than in angle.
The down-leg is shared across the three targets: one descent, three
ascents.
The fold proxy is the number of ray legs landing in a cell.
It scales with acquisition fold but is scaled by the ray fan density, so it
is a relative measure. Use it to compare designs, not as
an absolute fold for volume calculations.
The 5D and FWI figures come from the acquisition geometry
alone — shot and receiver coordinates in closed form — so they
are exact and independent of the ray fan.
Figures
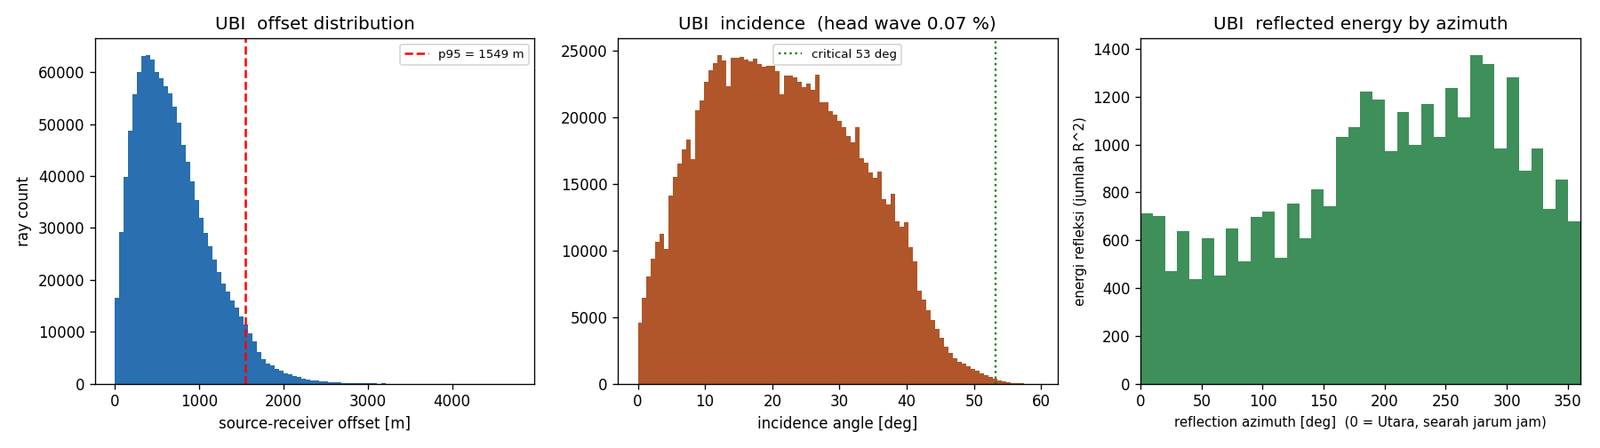
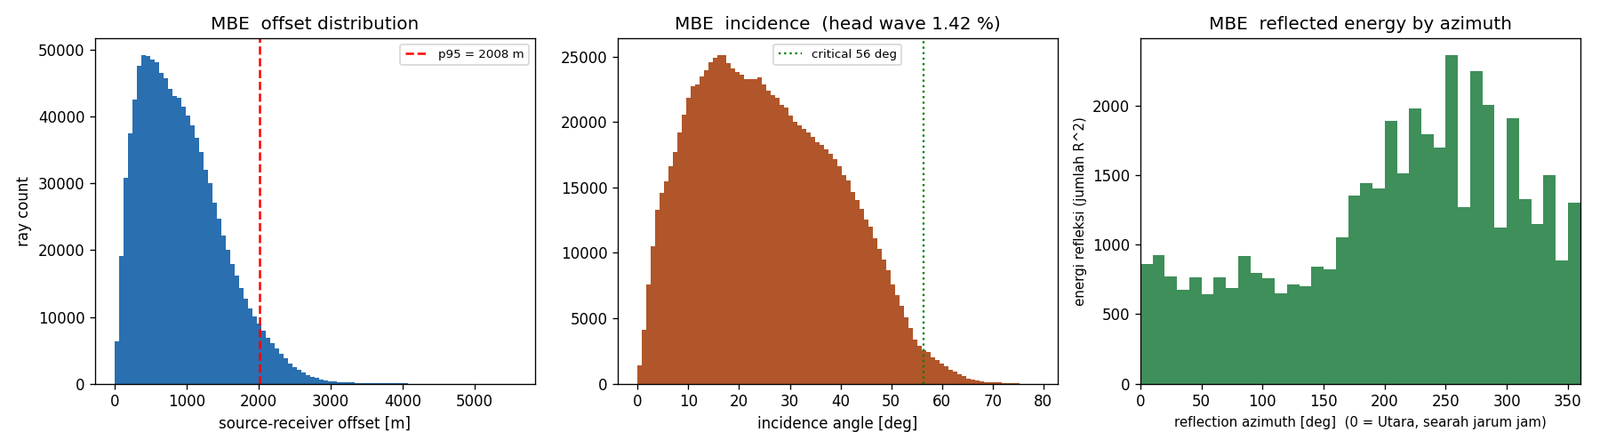
UBI: offset, incidence with the critical angle marked, and
reflected energy by azimuth.MBE: same three panels.UPM: same three panels. Compare the offset axis with the
earlier two — the deep target is sampled at much larger separation.
Files
Grids: data/grids.json · raw arrays:
data/maps_*.npz, data/surface_*.npz ·
5D / FWI metrics: data/five_d_fwi.json ·
acquisition geometry for GIS: data/survey_geometry.geojson
(WGS84, drops straight into QGIS or ArcGIS) · numeric summary:
data/report.json.
10Fold analysis: shooting template and constraint zone
Fold is the one quantity in this study that can be quoted to a client
without any interpretation at all. This part collects the two measurements
that matter, on one 20 m CMP bin, and states plainly which of them is
the nominal formula and which is the measured result.
Source: data/fold_analysis.json, written by
make_fold_analysis.py from the measured output of
make_template_current.py and
make_fold_zone_fig.py. Nothing on this page is typed in by
hand, so the table cannot drift away from the two figures below.
Figure 6. The shooting
template actually used for this study, 24 source lines × 140 SP, with
the receiver lines orthogonal. (a) CMP fold on a 20 m bin with the
acquisition lines overlaid; the diagonal high-fold band runs at the shooting
direction. (b) Nominal fold from the two GPS factors, next to the fold
measured on the same bin. (c) Offset–azimuth distribution of all
source–receiver pairs. (d) Template parameters and the production
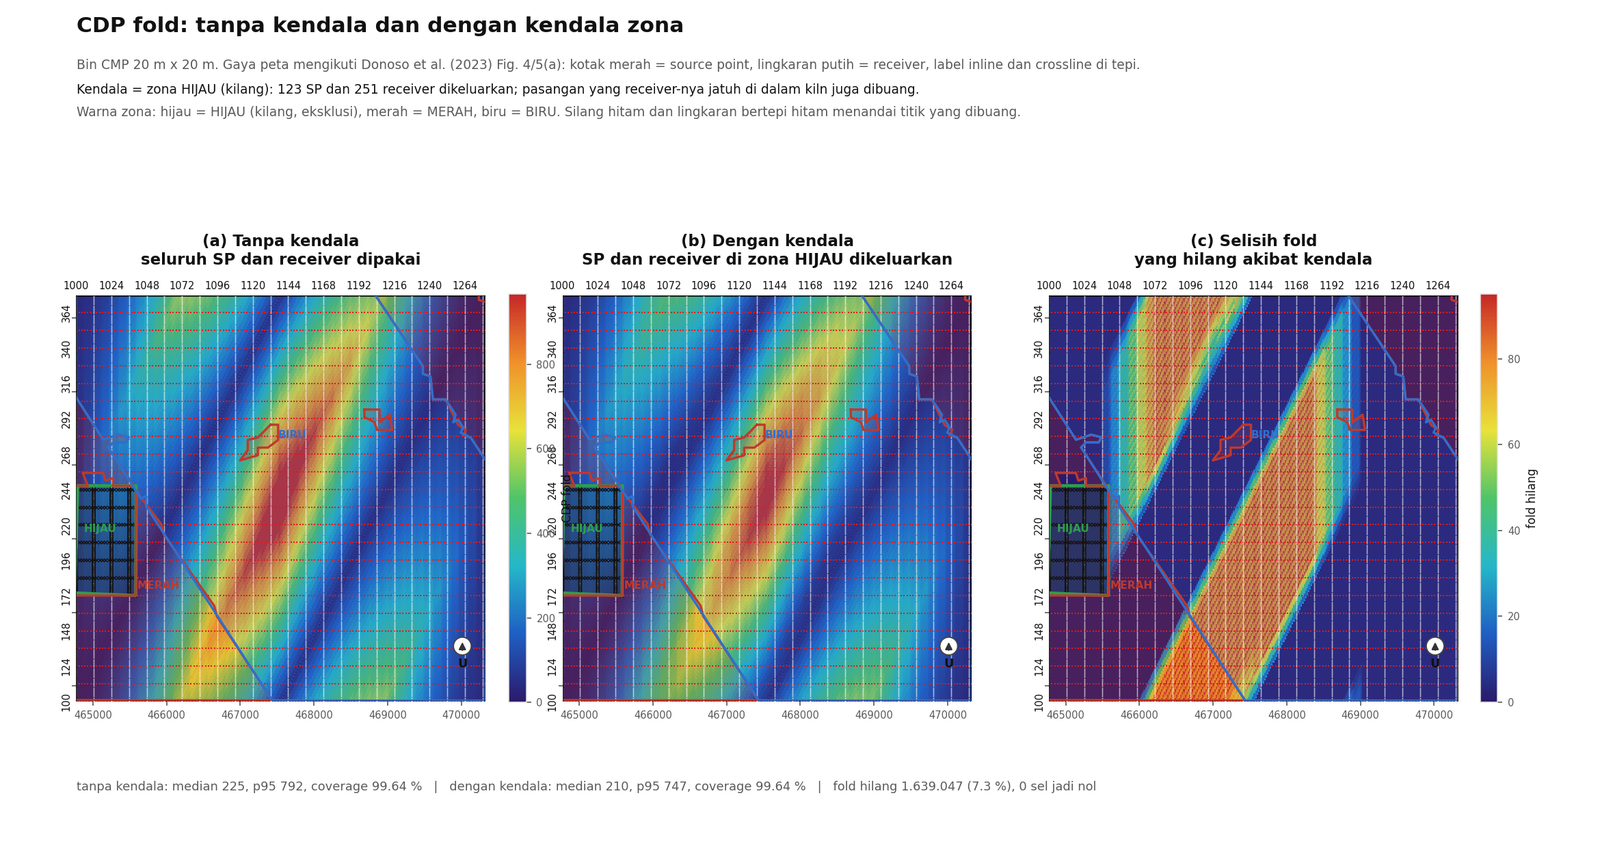
estimate they imply.Figure 7. CDP fold with and
without the constraint zone. (a) Baseline: the full template,
nothing removed. (b) The same template with the constraint zone excluded.
(c) The difference between them, in absolute fold. (d) Summary.
What the constraint zone actually costs
The zone takes source points and receivers out of the survey, and the fold
falls with them. What it does not do is open a hole in the
coverage: no cell drops to zero and the covered fraction is unchanged to
four decimal places. The constraint therefore costs coherency, not
illumination. That is a materially different conversation from item A in
section 3, where the coverage is identical but almost all the fold
disappears — there the acquisition is intact but the signal-to-noise
is gone.
How to quote fold in a commercial document
Quote 140 nominal as the design figure, because that is
what the geometry produces on paper and what the contract is written
against. Quote the measured median and 95th percentile
when someone asks what the data will actually look like, because the
nominal assumes an ideal bin and ignores the ragged edges of the
acquisition footprint. The measured numbers are higher than the
nominal here, because the 20 m bin is smaller than the 240 m
line interval and several source lines land in one bin. The nominal value
is the conservative one and should stay the headline.
Two things this part does not tell you
CMP fold counts pairs; it does not measure resolution or amplitude. A
survey can hold nominal fold and still image poorly if those pairs arrive
from the same narrow azimuth sector, which is why the rose in
Figure 1(c) is reported next to the fold map rather than on its
own. And the constraint-zone numbers assume the zone is a hard exclusion.
If the field crew routes around it instead, the geometry changes and these
numbers have to be re-measured.